TRADE ROOM

Real Trades. Real Lessons.
This page documents my trading activity through real charts and trades, helping me track my consistency, evaluate my decisions, and learn from both successes and failures.

The purpose is not to show off results or make grand claims, but to share practical examples of what works for me, in the hope that other traders can learn from the process. Trading is challenging, and many traders struggle to achieve consistency. Sharing real experiences can help make that journey a little easier.

Reviewing past successful and failed setups helps reinforce the chart patterns you should be looking for, sharpen your judgment, and improve your decision-making over time.

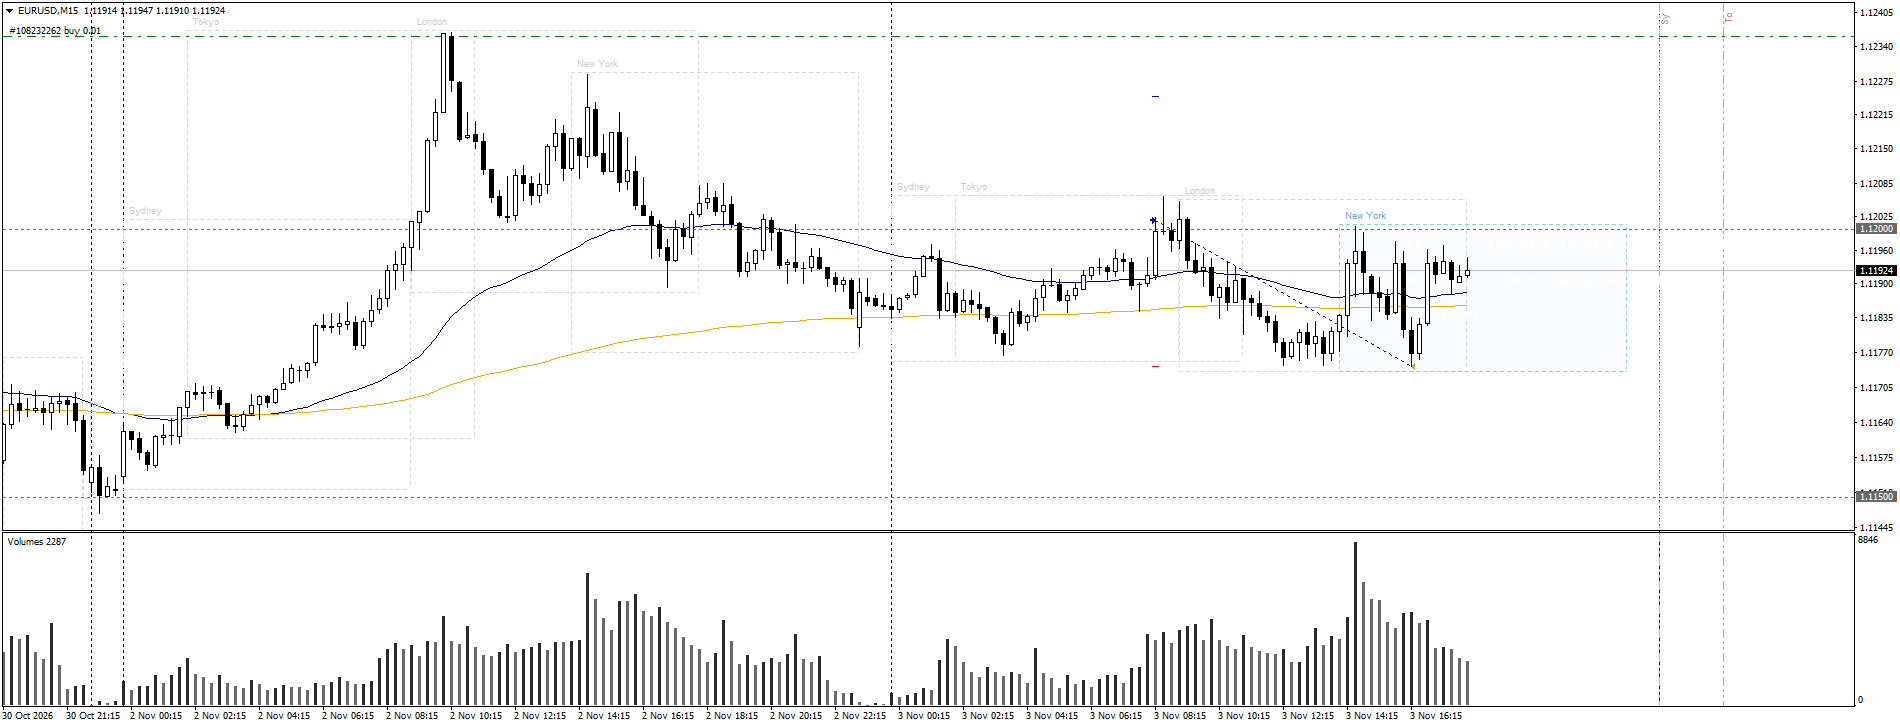
Loss Trade EURUSD

Trends flat multiple stop hunts

loss trade eurusd 0311 26

after reassessing the chart I thing I missed trends were flat
price was lieing, since yesterday top volume increased when price went down
and the top i bought today was just a stop hunt, and a head fake to insitgh
wrong siders to enter the market.

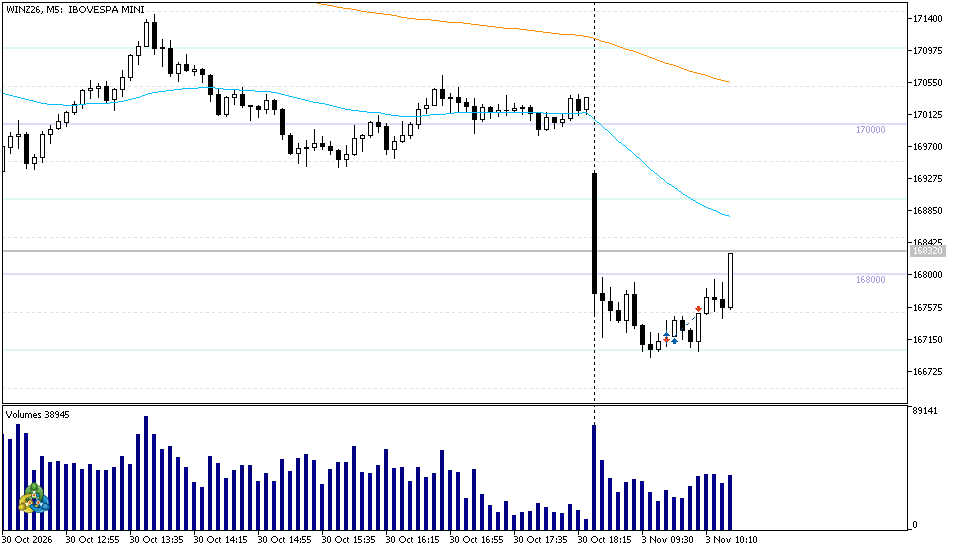
Win trade BR50

win trade winbr 0311

trends stacked berish
market gapped down with a good trigger for short at the open
MMs supported the price at WL 167, ran a stop hunt and raised PA above
towards upper WL.
EP fast in and out for 300 points.

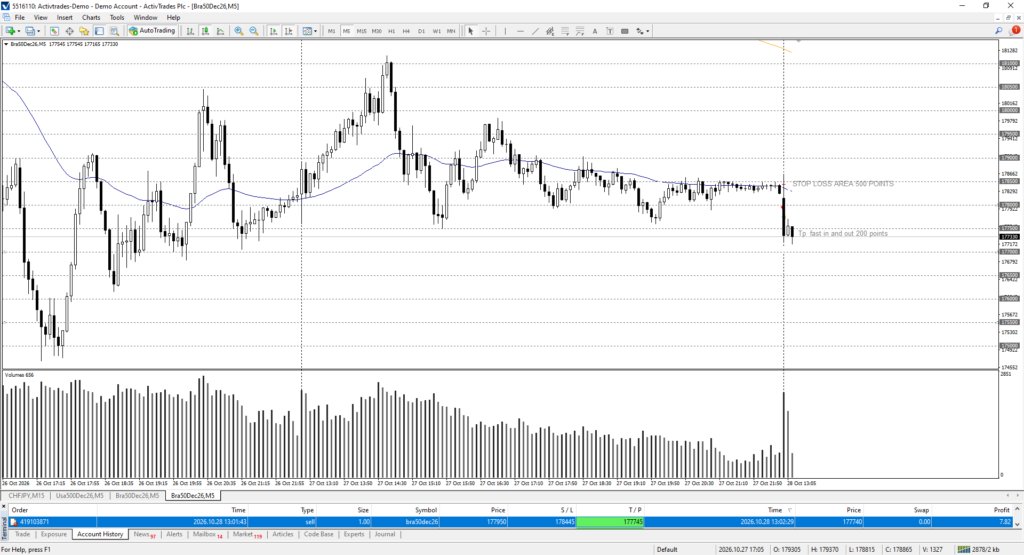
BRA50 Win trade at the open fast in and out

win trade short 2810

why short this trade for only 200 points?
Trends are stacked berish after bamastic elections surprise
markets open 20% down expectations are berish and fearfull
at the open market text the close of yesterday but starts to gain momentum
down
A trade very quick is more safe in such volatile moment and odds are favorable
even with R/R 2/1, 500 poins stop give more room for volatility withou been stop hunted
and a short target will win more times then it loses.

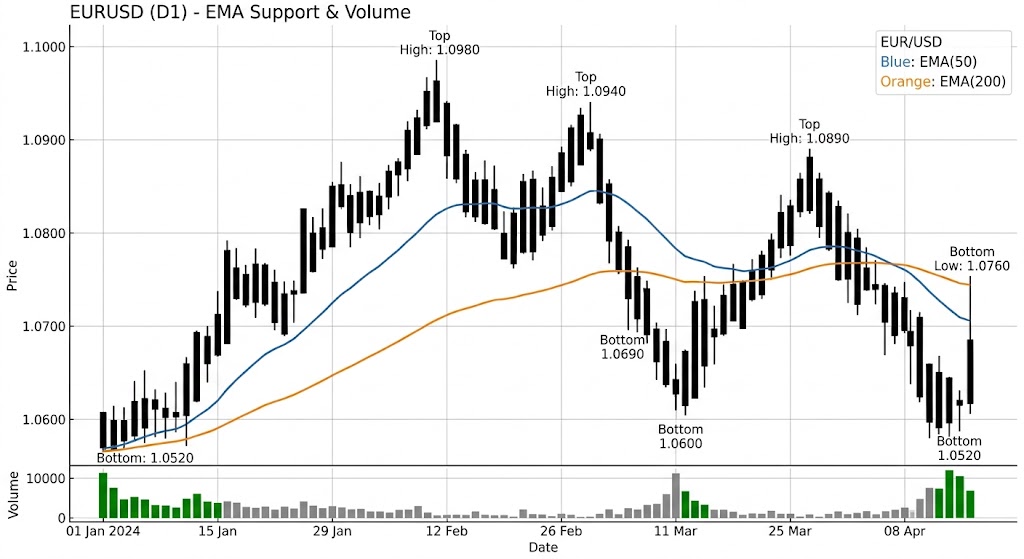
Textbook for consistency in trading

this chart is an example of volume on lows indicating bullish activity1

111111111111111111111111111111lllllllllllllllllllllllljjjjjjjjjjjjjjjjjjj

gggggggggggggggggggggggggggggggggggggggggg

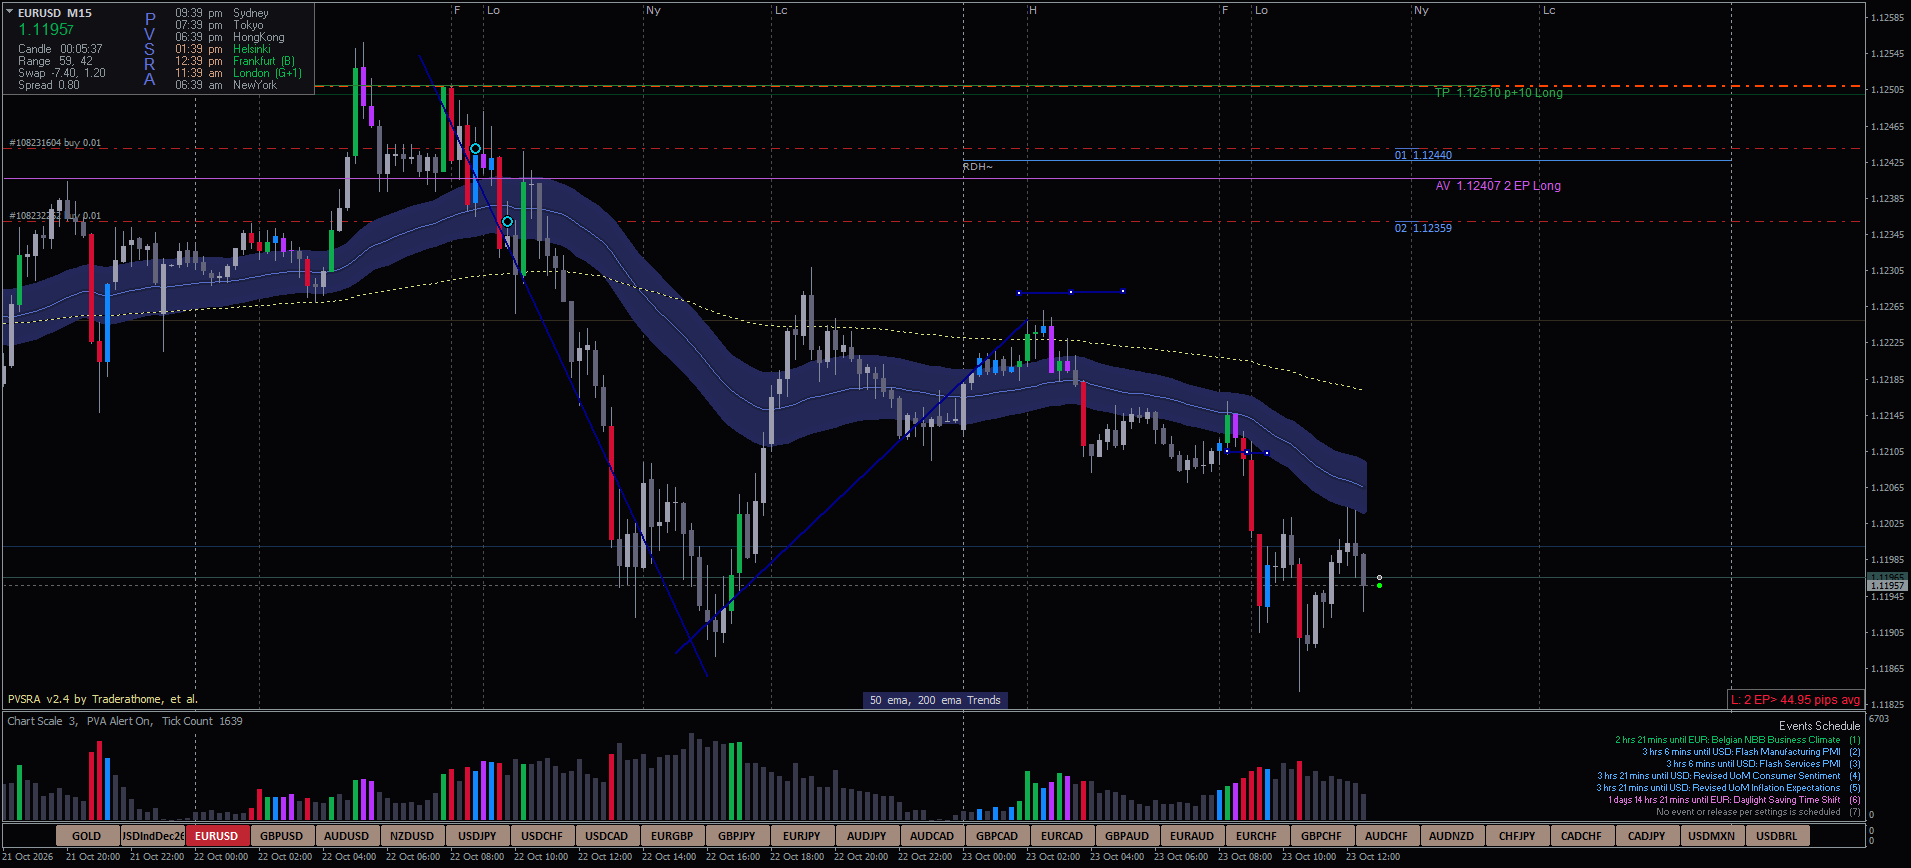
Patience Pays: Waiting for Bearish Alignment

setup faled to stop and showed excellent set righ ahead eurusdm15

The two magenta down bars during the Asian session could be interpreted as an early bearish clue.

For the first trade, two strong red bars drove the price down, followed by an up bar that could have represented a stop hunt near the low of the day, before a green bar encouraged longs to enter.

Looking carefully at the chart in hindsight, the price action appears much more bearish than it did at the time of the trade. The sellers pushed the price down, and the trade should have been stopped out below the immediate quarter level.

Price then began to work below the trend indicators, which stacked bearish first on the 15-minute chart and subsequently on the 60-minute chart.

The London Open presented a textbook “good setup”: trends stacked bearish on both the 15-minute and 60-minute charts, continued selling pressure from the previous move, and momentum building as the trend lines bent downward.

The setup was clear, but it required patience.

The stop-loss location was well defined, with a relatively low cost in terms of risk, while the 20-pip target had plenty of room to run. The move had not yet exhausted its downside potential.

Key lesson: A clear setup does not always appear immediately. Waiting for bearish alignment across multiple timeframes, confirming momentum, and identifying a well-defined, affordable stop-loss can help distinguish a high-quality opportunity from an early, premature entry.